
MOVE 2.0 explained: what it measures, and what it cannot see
Australia now trades outdoor on MOVE 2.0. Here is what the new currency measures, where modelled audiences stop, and how observed per-play data fits alongside it.
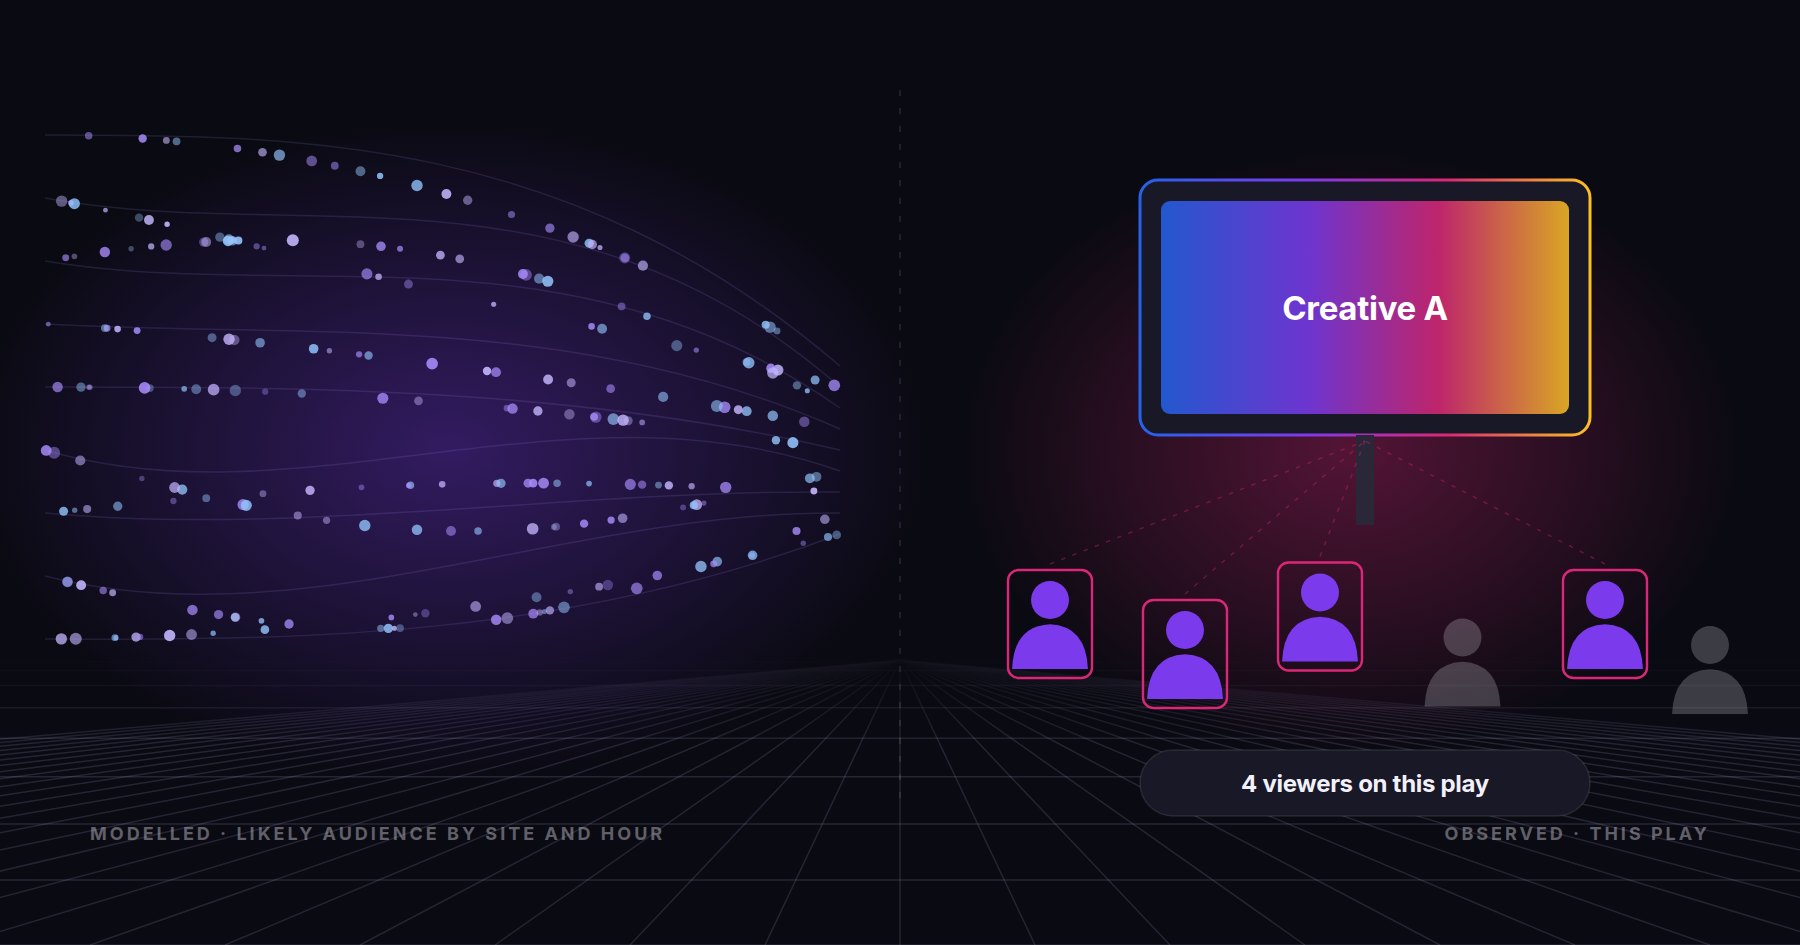
On 16 March 2026, Australian outdoor switched to a new audience currency. MOVE 2.0, run by the Outdoor Media Association, is now how the industry plans, buys and reports out-of-home. If you sell or buy outdoor in Australia, it is the number your work is judged against.
It is also widely misunderstood. Here is what MOVE 2.0 measures, what it is designed not to do, and how observed data at the screen fits alongside it.
What MOVE 2.0 is
MOVE estimates how many people are likely to see an outdoor sign. Its headline metric is Visibility-Adjusted Contacts: not just people passing a site, but people likely to have the sign in view.
- A synthetic population. 2.2 million simulated people, built from real-world measurement data to reproduce how Australians move.
- About 180,000 sites, static and digital.
- Hour by hour, day by day reporting.
- Regional and place-based environments included for the first time.
It is a substantial piece of work, built with the major media owners. For the first time the whole industry trades on one consistent, comparable number. That matters, and it is good for everyone selling outdoor.
What a currency is for
A currency has one job: give buyers and sellers a shared, consistent unit to trade on. To do that, it has to be modelled. It must cover every site the same way, including sites with no sensors, and it must be available before a campaign runs, so it can be planned against.
That design choice is a strength. It also means some questions are outside what a currency is built to answer.
What it is not designed to see
| Question | MOVE 2.0 | Observed at the screen |
|---|---|---|
| How many people are likely to see this site at 8am on a Tuesday? | Yes, modelled | Yes, measured over time |
| How many people looked during this specific play? | No | Yes |
| Did creative A hold attention longer than creative B? | No | Yes, view time per creative |
| What changed on a game day, a sale or a road closure? | Not in the moment | Yes, as it happens |
| Was the screen actually on and playing? | No | Yes, joined to proof-of-play |
| Can I plan a campaign before it runs? | Yes | Yes, from site history |
None of this is a criticism of MOVE. A model of the likely audience cannot also be a record of what happened on a particular play. They are different instruments for different jobs.
Trade on MOVE. Prove with observed data.
The practical answer is to use both. Plan and trade on the currency. Then use observed, per-play data to prove what happened, and to improve what you sell next.
- For media owners: show which sites and dayparts outperform their modelled audience, and price them accordingly.
- For agencies: report delivery and measured audience per play alongside the MOVE plan, and answer the client's "did it work?"
- For brands: compare creatives by real attention, not just by how often they ran.
- For venue networks: show the audience inside your own environment, where people's behaviour can shift by the hour.
How UrbanIQ fits
UrbanIQ measures the audience in front of each screen with an anonymous, on-device agent. It separates people who looked from people who walked past, and joins every number to a verified play from your CMS. Nothing that could identify a person is calculated or stored.
We see it as the layer underneath the currency: the evidence for what happened on each play. If you want to see the two side by side for your own network, book a demo below. To see how per-play reporting works in practice, read about proof-of-play.